
You are viewing an archived web page that is no longer maintained. View current CISN web pages
Details | Background | Ground motions | Maps | Waveforms | Related links
| Information from the CISN | |
| Date & Time (Local): | 2002/11/24 06:54:23 (PST) |
| Date & Time (UTC): | 2002/11/24 14:54:23 (UTC) |
| Location: | 3 km (2 miles) SE of San Ramon, CA 37.7602 -121.9502 |
| Depth (km): | 11.23 |
| Mw: | 3.9 |

November 29, 10:30 PST: No events of M3 or higher have occurred in this sequence since Tuesday morning. The rate of events detected by the automatic systems has also slowed - a total of 124 events have been recorded in this swarm as of this time.
November 27, 09:00 PST: An ML 3.0 earthquake occurred this morning, at 05:26 PST. The sequence now consists of 7 events of M3 of higher. Over 113 events have been located in this swarm by the automatic systems as of this morning.
November 26, 04:38 PST: An ML 3.7 earthquake occurred this morning. The automatic systems have located over 50 events in this swarm, with 8 over magnitude 2.5.
November 25, 18:00 PST: A swarm of small to mild earthquakes is occurring in the area about 2 miles SE of San Ramon, CA. The swarm began with a magnitude 3.9 (Mw) earthquake which occurred at 06:54 AM PST on Sunday morning, November 24. A second mild earthquake occurred at 05:57 PM on Sunday evening, November 24, which has a magnitude of 3.8 (ML) and third event of ML 3.5 occurred Monday morning, November 25th, at 10:22 AM.
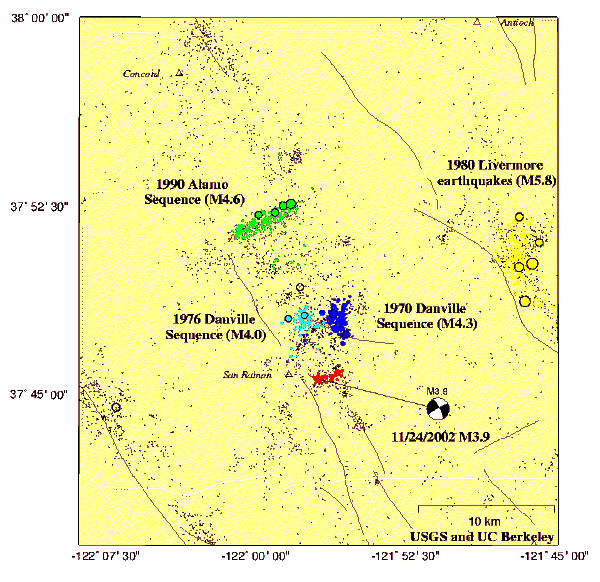
These events were initially associated with the Calaveras fault. However, a detailed analysis of the aftershock locations shows that these events form a lineation to the northeast, along the left-lateral, strike-slip fault plane consistent with observed focal mechanisms.
The northern section of the Calaveras Fault has witnessed several earthquake swarms over the years. Swarms occurred near Danville in 1970 and 1976. In the 1970 sequence, there 353 earthquakes between May 22 and June 19. The largest of the 1970 sequence were two earthquakes, magnitude 4.3 and 4.2, which occurred on June 12. Further north, earthquakes in 1990 illuminated a northeast/southwest lineation near Alamo. This sequence persisted for 6 weeks and sustained 350 earthquakes. There were 13 events above M3.0, and the largest event was M4.6.
According to the 1999 study on earthquake probabilities in the San Francisco Bay Area, the Calaveras fault has an 18% probability of a M6.7 or higher earthquake in the next 30 years. The northern section of the Calaveras fault ruptured in a ~M6 earthquake in 1861, and surface rupture was observed over a distance of 13 km.
Seismologists are unable to determine if this sequence will trigger a larger quake on the Calaveras fault. The most likely scenario is that the earthquake swarm will persist for a few weeks in a fashion similar to the above sequences, and that earthquakes as large as M4 could occur.
Lind Gee and David Oppenheimer
The CISN Northern California Management Center produces ShakeMaps for events of M3.5 and higher. ShakeMaps are based on the observed ground motions from seismic instruments combined with predicted motions in areas without sensors. In this swarm, ShakeMaps have been produced for several events.
 11/24 M3.9 |
 11/24 M3.8 |
 11/25 M3.5 |
 11/26 M3.7 |
Many earthquakes in this swarm have been widely felt in the San Francisco Bay Area. People with Internet access can report their observations of shaking and damage through the Did You Feel It? Web site. In the links below, you can see the maps illustrating the reported intensities for several events in this sequence. Unlike the ShakeMaps - which are based on data from seismic instruments - these maps are based on human observations. You can contribute to these data by filling out the form for each event.
 11/24 M3.9 |
 11/24 M3.8 |
 11/25 M3.5 |
 11/26 M3.8 |
These links will take you to seismocams showing current earthquake activity.
Below are links to waveforms for the M3.9 event.
This 1999 Earthquake Probability Study concluded that there is a 70% likelihood of an M6.7 or higher in the Bay Area between 2000 and 2030. The probability for the Calaveras fault was assessed at 18%.
This Web site from the Association of Bay Area Governments has intensity maps for various scenario earthquakes in the San Francisco Bay Area.
Researchers at several institutions are using small earthquakes to study the behavior of the Calaveras fault. Here are links to several research groups: