
You are viewing an archived web page that is no longer maintained. View current CISN web pages
Details | Ground motions | Maps | Waveforms | Related links
| Information from the CISN | |
| Date & Time (Local): | 2003/02/02 10:22:58 (PST) |
| Date & Time (UTC): | 2003/02/02 18:22:58 (UTC) |
| Location: | 4 km (3 miles) N of Dublin, CA 37.7400 -121.9370 |
| Depth (km): | 16.5 |
| ML: | 4.2 |
 February 2, 14:00 PST: Happy Groundhog Day!
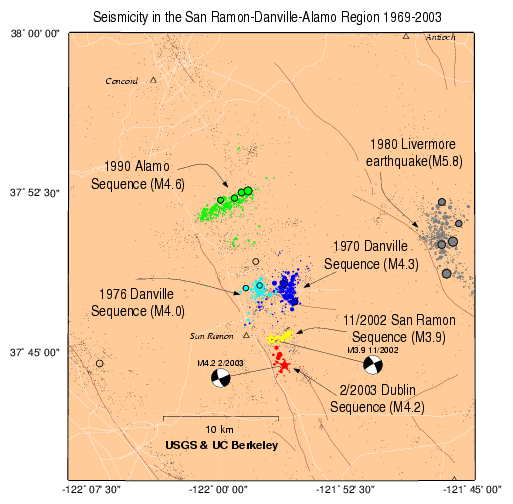
The residents of the Dublin-San Ramon area awakened to a small sequence
of earthquakes this morning. This earthquake sequence is located within the
Calavears fault zone and immediately to the south of the
November 2002 swarm.
Preliminary locations
reveal a trend parallel to the Calaveras fault.
In contrast, the November sequence showed a trend that was oriented
perpendicular to the Calaveras and northeast of the fault. The current
sequence locates less than a mile to the east of the Calaveras fault.
Given the uncertainty in hypocenter locations, it suggests that the
quakes are occurring on the Calaveras. The various
focal
mechanisms,
which reveal the
fault
orientation
and sense of motion on the fault are also consistent with this
interpretation. However, the computed fault planes dip slightly to the
southwest, rather than the northeast as would be expected for locations
that are northeast of the fault. At present, we believe the discrepancy
can be accounted for by computed uncertainties in earthquake locations
and mechanisms.
As of this time, the largest event in this sequence is an M4.2 which ocurred at 10:22 local time. Like the events in November, this sequence shows the characteristics of a swarm - it includes an M3.6 at 8:22, M3.0 at 08:45, M4.2 at 10:22, M4.0 at 10:47, and M3.5 at 11:02. Past swarms of earthquakes in this vicinity have persisted for weeks. During the last 30 years the maximum magnitudes of other swarms in the region have not exceed M5. However, since these quakes appear to be on the Calaveras fault, we remind the public that the Calaveras fault has the capability to rupture in a M7. The probability that the northern Calaveras will rupture in an earthquake of magnitude greater or equal to M6.7 is 18% over the next 30 years. Historically, the northern section of the Calaveras fault produced a ~M6 earthquake in 1861.
David Oppenheimer, Lind Gee, and Bill Ellsworth
The CISN Northern California Management Center produces ShakeMaps for events of M3.5 and higher. ShakeMaps are based on the observed ground motions from seismic instruments combined with predicted motions in areas without sensors. In this swarm, ShakeMaps have been produced for several events.
 02/02 M3.6 |
 02/02 M4.2 |
 02/02 M4.0 |
The CISN Engineering Data Center produces reports showing details of ground motions for events of interest. They have issued an Internet Quick Report (IQR) for the M4.2 showing records from the Dublin Fire Station (3.5 km away) as well as other sites of interest:
Many earthquakes in this swarm have been widely felt in the San Francisco Bay Area. People with Internet access can report their observations of shaking and damage through the Did You Feel It? Web site. In the links below, you can see the maps illustrating the reported intensities for several events in this sequence. Unlike the ShakeMaps - which are based on data from seismic instruments - these maps are based on human observations. You can contribute to these data by filling out the form for each event.
 02/02 M2.9 |
 02/02 M3.6 |
 02/02 M3.0 |
 02/02 M4.2 |
 02/02 M4.0 |
 02/02 M3.5 |
These links will take you to seismocams showing current earthquake activity.
Below are links to waveforms for the M4.2 event.
This 1999 Earthquake Probability Study concluded that there is a 70% likelihood of an M6.7 or higher in the Bay Area between 2000 and 2030. The probability for the Calaveras fault was assessed at 18%.
This Web site from the Association of Bay Area Governments has intensity maps for various scenario earthquakes in the San Francisco Bay Area.
Researchers at several institutions are using small earthquakes to study the behavior of the Calaveras fault. Here are links to several research groups: